The Google site speed test, PageSpeed Insights (PSI), has been around since 2017 and since then has likely been used by web developers, SEO companies, and website owners all over the world. Our South Florida marketing agency has used this test many times before, and it almost always displays a result that is less than favorable. Sites that we are sinking time and money into seem to be doing poorly in the speed category. The best result we have ever seen was “average.” However, considering that most, if not all, of these sites receive these results even when they’re performing well in other aspects on Google, we can’t help but wonder, “How reliable is the Google page insights tool?”
What Is Google Pagespeed Insights & How Does It Work?
Google PageSpeed Insights is a Google performance testing tool used to analyze the user experience of a page, on both mobile and desktop devices, and provides suggestions on how said page may be improved. You can enter any URL, and it will analyze it for you.
Google PageSpeed Insights tests pages for the following:
- First Contentful Paint (FCP)
- First Input Delay (FID)
- Largest Contentful Paint (LCP)
- Cumulative Layout Shift (CLS)
- Interaction to Next Paint (INP)
- Time to First Byte (TTFB)
PSI displays and measures the efficacy of these metrics according to three categories: Good, Needs Improvement, and Poor, which are represented by green, amber, and red bars. Core Web Vitals metrics are also included in Google’s online speed tracker for websites.
Core web vitals are a common set of performance signals necessary to all web experiences and include metrics like First Input Delay (FID), Largest Contentful Paint (LCP), and Cumulative Layout Shift (CLS). PSI also uses the Google Lighthouse tool to analyze the given URL for Performance, Accessibility, Best Practices, and SEO categories.
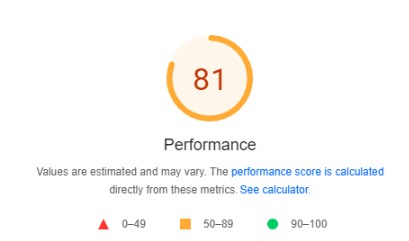
One major aspect of Google page insights testing, that web developers and digital marketers look at, is the score. Scores for each category are provided at the top of the test. A score of 90 or higher is considered good, 50 to 89 is considered a score that needs improvement, and anything below 50 is considered poor.
Testing the Google Page Insights Tool Ourselves
As helpful as it is, Google PageSpeed Insights is considered to have one of the highest standards of website testing tools available. As we previously mentioned, the best score we’ve seen is “average,” and usually, “average” means less than 4.4 seconds of load time on a 3G network.
While this would have once been considered to be pretty darn good for 3G – an outdated, WiFi-alternative means of connecting to the internet for mobile devices – Google’s site speed test tests websites on 4G networks, which changed the game.
Now we can see how fast our site is on faster networks. This came after 5G was announced by AT&T, as well, meaning that we needed to take advantage of this next step. So, I decided to test another client, a client whose site runs very quickly. Here is a snapshot of that client’s speed for the past week, according to Analytics.
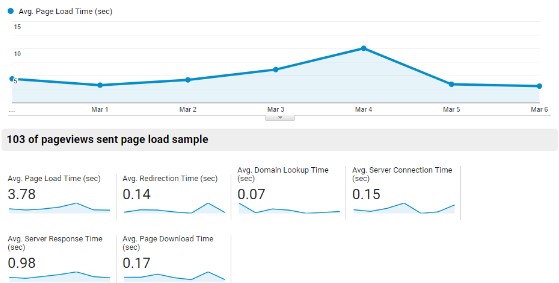
There was a spike on March 4 because of some dev work, but you can see the average page load time is 3.78 seconds. It would have been as low as 3.35 seconds if it weren’t for that dev-related spike.
Still, this is pretty darn quick for an e-commerce site on WordPress with lots of products, descriptions, reviews, and a heavy blog. Not bad, right?
So, I tested this on the new and improved Google site speed tester and…received a bad score, as usual. Not again! Drats!
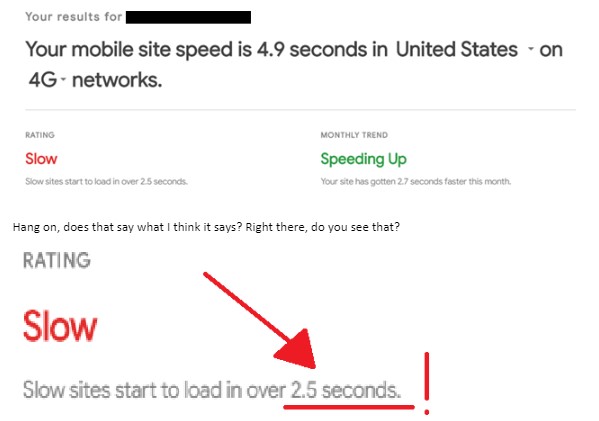
Do slow sites start to load in over 2.5 seconds? WHAT? I mean, honestly, how can we expect sites to be faster than 3 seconds or even faster than 2 seconds? Unless they are on fiber optic lines connected to phones with 5G powered by intergalactic energies and the prayers of a thousand monks, how in the blue blazes is it possible to get a better score? Unless NASA is working on an internet connection that moves at the speed of light, then what are we aiming for here?
I get it. We all need to dream big, but is a site with any content going to be faster than 2.5 seconds? So, I decided to channel my inner investigative journalist, and I ran some other tests using Google’s site speed checker. And here’s what I found:
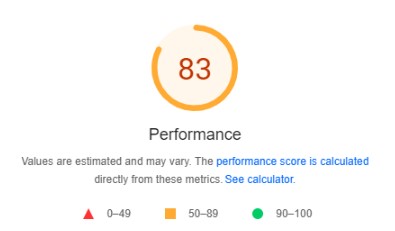
The last time I checked Twitter on Google PSI, it received the second fastest score of all the sites I checked, clocking in at an ear-splitting 1.5-second load time. Google rated it average. However, after testing this website four years later, this is what we found for Mobile and Desktop performance:
Mobile: 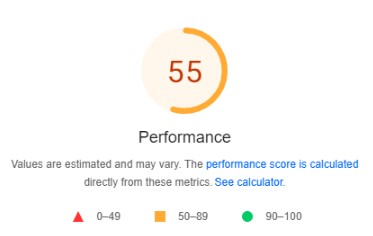
Desktop:
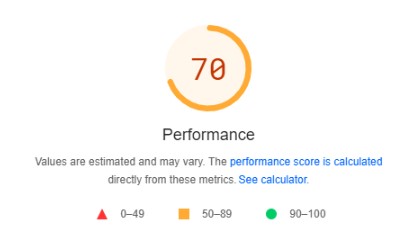
The last time we checked Facebook, we found that it had a turtle-pace load time of 2.9 seconds. But what about its current scores?
Mobile:
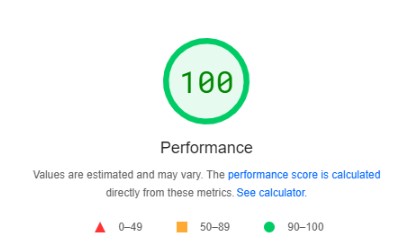
Desktop: 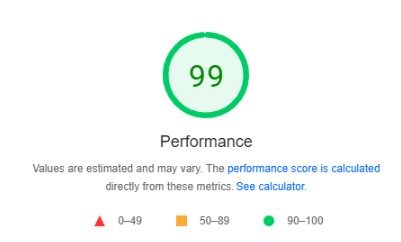
Although Twitter once showed better scores than Facebook, the tables seemed to have turned!
Google Site Speed Checker
That’s right, I even checked the checker using itself. Inception speed test stuff. And unsurprisingly, it received the highest scores out of all the sites we tested.
Mobile:
Desktop:
While Google’s desktop performance is mint, what’s happening with their mobile performance? Considering that most online users are mobile nowadays, the search engine seems to be dropping the ball a bit.
So, after all of this testing, how reliable is Google PageSpeed Insights? Although Google’s page insights tool offers a detailed analysis of the web page’s performance on mobile and desktop, it’s not as reliable as some other tools, including Sematext, Pingdom Speed Test, Uptrends, and GTmetrix. Additionally, as a Fort Lauderdale digital marketing agency familiar with experience in using such tools, we discourage anyone from relying on one major tool in which to test their site.
What You Should Use Instead of Google Mobile Site Speed Test
Now that you know the google speed test is accurate for certain things and not all things, we encourage you to use a wide range of tools when analyzing your website’s performance to avoid being kept in a box. There are so many tools out there and ways to improve your website. Google’s PageSpeed Insights test shouldn’t be the only one you go to for answers.
Instead, use Google Analytics’ Site Speed tab in the Behavior section of Google. Yes, it’s still Google, but it is reliable, and it provides much better analysis and often more accurate site speed results. There are also site speed plugins that work well, including GTMetrix, Pingdom Tools, and Monitis. Use anything other than the free Google tool.

Improve Your Site’s Performance With Tandem Buzz
With PPC, SEO, and social media specialists on our team, our digital marketers in Florida are trained and experienced to support clients’ marketing strategies in every way possible. From effective SEO services that help organic traffic to social media packages designed to boost your site’s online presence, we offer a wide range of digital marketing services that can take your business to the next level.
For more information about our services and how we can support your business, give Tandem a buzz today! If you want to read more blogs like this one and learn more from our experts, check out our online marketing blog here.
Related Reading:


")
